


How to use ChatGPT to check PC health: two safe methods
This guide walks through how to run a ChatGPT PC health check using only the system telemetry Windows already exposes to IT support. No personal files, documents, or passwords involved. Two paths, depending on how deep you need to go.
Method One works with any AI chatbot and takes about five minutes. Method Two delivers live, correlated diagnostics through an open-source local server and is built for users comfortable with a terminal. Most readers should start with Method One and stop there.
The distinction matters because "AI on your PC" covers a wide spectrum of trust models. Microsoft Recall screenshots everything you do and indexes it into a searchable database. Security researcher Kevin Beaumont tested it and found it captured Signal messages, credit card numbers, and CVVs despite filtering protections his analysis was last updated less than three weeks ago. Both methods here are structurally different: read-only access to support-grade telemetry, not a record of user activity.
Prerequisites
- Windows 10 or Windows 11
- A ChatGPT, Claude, or Gemini account (any tier) for Method One
- Claude Code, Node.js, and basic terminal comfort for Method Two only
Two methods, two trust boundaries: which one is right for you
Method One: MSINFO32 snapshot + any AI chatbot
MSINFO32 is built into every modern version of Windows. It compiles a structured snapshot of hardware configuration, installed drivers, and software environment: component identifiers, version numbers, conflict flags. As TecnoBlog covered earlier this year, the tool collects no personal files, photos, emails, or passwords. Export the report as a plain text file, paste it into a chatbot. No new software, no elevated permissions, no ongoing access.
Method Two: MCP OS Doctor + Claude Code
MCP OS Doctor is an open-source, read-only local server that feeds live Windows telemetry to Claude Code via the Model Context Protocol. It covers event logs, active processes, hardware sensors, GPU state, DirectX, and boot history in real time. The GitHub repository documents the constraints explicitly: no write operations, no command execution, no PowerShell invocations, no network listener, no credential handling. It is a live feed rather than a snapshot, which makes it better suited for cross-source correlation.
| MSINFO32 + chatbot | MCP OS Doctor + Claude Code | |
|---|---|---|
| Data type | Point-in-time snapshot | Live telemetry |
| Best for | Driver issues, hardware conflicts, startup/service review | Event log patterns, sensor data, correlated crash diagnosis |
| Installation required | None | Node.js + MCP configuration |
| AI access required | Any chatbot | Claude Code |
| Skill level | Beginner | Intermediate/Advanced |
Start here if you're unsure: Method One handles problem devices, driver conflicts, BIOS version issues, and startup clutter. Go to Method Two only if you need live event-log or sensor correlation and are comfortable configuring local tooling.
What either method can and cannot find
Both work well for driver version conflicts, flagged problem devices, resource contention, WHEA hardware error patterns, service anomalies, and startup bloat. They are less useful for intermittent software bugs that leave no event log trace, network-layer problems requiring active traffic analysis, or crash dump parsing, which typically requires broader file access than either method provides. The AI output is triage. Verify before acting.
Check Windows health with ChatGPT using MSINFO32
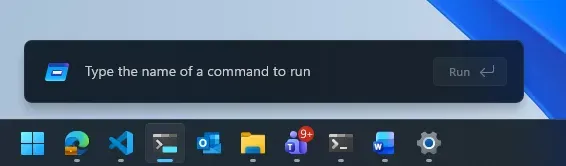
Step 1: Open MSINFO32
Press Windows + R, type msinfo32, and press Enter. The System Information window opens. Wait until the status bar at the bottom stops updating before proceeding it is still collecting data until then.
Step 2: Export a targeted report
For a general health check, export the full report. For a focused investigation covering crashes, device conflicts, or resource issues, use a targeted command-line export instead. This produces a smaller, more useful file.
General full export:
msinfo32 /report C:\Temp\pc-health.txt
Focused export covering problem devices and resource conflicts:
msinfo32 /nfo C:\Temp\conflicts.nfo /categories +componentsproblemdevices+resourcesconflicts+resourcesforcedhardware
Use /report for anything going into a chatbot. It produces plain text you can paste directly. The /nfo format is MSINFO32's native format and preserves the full category tree structure, but it is not suited for chatbot review. Both formats are documented in MundoWin's guide to the tool, which also notes that MSINFO32 and DXDiag exports are standard in professional technical support workflows the files IT teams routinely request when diagnosing hardware and application issues.
Step 3: Review the file before pasting
Open the .txt file and scan it. The report includes installed application names, hardware identifiers, and network adapter names. Nothing here is a password, document, or file content. That said, network adapter names occasionally include a hostname or personal detail if you named your network that way. Thirty seconds is enough.
Step 4: Paste into your chatbot with a specific prompt
Open ChatGPT, Claude, or Gemini. Paste the report text and use a targeted prompt:
"This is my Windows System Information export. Review it for hardware conflicts, problem devices, driver issues, BIOS version issues, and anything that might affect system stability or performance. Give me a prioritized list of findings with a brief explanation of each."
The more targeted the prompt, the sharper the response. "I'm getting random crashes under load focus on hardware and driver sections" will produce more actionable output than a generic health check request.
Step 5: Interpret results and follow up
The AI will return prioritized findings across flagged devices, conflicting resources, suspicious drivers, and unusual startup entries. Output typically looks like this:
- Critical: Problem devices flagged with error codes (e.g., Code 43 on a GPU)
- Notable: Driver versions that are significantly outdated or flagged as potentially conflicting
- Low priority: Startup entries or services adding overhead
Ask follow-up questions on anything flagged: "What does that error code mean?", "How would I update that driver safely?"
Gotcha: AI chatbots can misattribute error codes or cite driver details confidently but incorrectly. Before acting on any specific recommendation especially driver updates or BIOS changes verify against Device Manager, Event Viewer, and the manufacturer's support documentation.
Method Two: MCP OS Doctor + Claude Code (advanced)
Why live diagnostics catch things a snapshot misses
A static MSINFO32 export shows your hardware configuration as it stands right now. What it cannot show is a pattern building over time.
Xndr.io documented a case earlier this year where Claude Code with terminal access diagnosed random system crashes by running systeminfo, Get-CimInstance Win32_PhysicalMemory, and a series of Get-WinEvent queries in sequence, using each result to decide what to check next. It identified a CAS latency mismatch between two RAM kits running at the same rated clock speed something the owner had examined himself and missed. Then it correlated that finding with WHEA memory subsystem errors in the System log that had been increasing in frequency over the prior two weeks. A single BIOS setting change stopped the crashes. The whole investigation took about three minutes, with most sessions completing in two to five minutes.
Two data sources, cross-referenced in real time, one root cause. Worth being clear about the boundaries, though: that case used Claude Code with terminal access, which is a broader permission model than MCP OS Doctor provides. MCP OS Doctor delivers a narrower, read-only version of the same diagnostic pattern. It feeds live event logs, sensor readings, and service states to Claude Code while keeping the permission boundary strict. An MSINFO32 snapshot would have shown the hardware configuration but not the error pattern accumulating across two weeks of system logs.
Step 1: Install Node.js and the MCP OS Doctor package
If Node.js is not already installed, download it from nodejs.org. Then open a terminal and run:
npm install -g mcp-os-doctor
Step 2: Add the server to Claude Code's MCP configuration
Open your Claude Code MCP settings file and add the os-doctor server entry as specified in the mcp-os-doctor README. The repository includes the exact JSON block to paste.
Step 3: Verify the connection
Restart Claude Code or run /mcp to check status. Per the project documentation, you should see os-doctor listed with 12 tools available. Confirm by asking: "What diagnostic tools do you have available?" Claude will call get_capabilities and return the full list, including current elevation status.
Elevation note: Some diagnostics require administrator privileges the Security event log being the main one. Run Claude Code from an elevated terminal if you need access to those logs. The
get_capabilitiesresponse confirms whether elevation is active.
Step 4: Run a health check
Ask directly: "Check my Windows system health and flag anything unusual in hardware sensors, services, or recent event logs." The assistant queries live system state across its available tools and returns prioritized findings.
Permission boundary: MCP OS Doctor's read-only constraint is real. It cannot execute commands, modify system state, or reach the network. If you use Claude Code with a terminal tool instead, the AI can execute commands it shows each one before running and requires your approval, but that is a fundamentally different trust model. Confirm which setup you are running before sharing system access.
Privacy note: MCP OS Doctor attempts to redact passwords, tokens, and API keys from output, but the project documentation explicitly describes this as best-effort and notes it may not catch every sensitive string in log or configuration output. Sensor monitoring data is also written to
%TEMP%\mcp-os-doctor\on your local disk, where it persists between sessions.
Wrapping up
For most readers, MSINFO32 with a targeted category export is the right call. It surfaces driver conflicts, problem devices, BIOS version issues, and configuration anomalies without installing anything new.
Reach for MCP OS Doctor when you have a persistent, hard-to-reproduce problem and need live event-log and sensor correlation the kind of analysis that caught a RAM timing mismatch building across two weeks of system logs when the hardware specs looked identical on paper.
One rule applies to both: when the AI flags a specific driver, error code, or hardware conflict, check Device Manager, pull the relevant Event Viewer log, and consult OEM documentation before touching BIOS settings or pushing a driver update. The output is a starting point, not a verdict.


Comments
Be the first, drop a comment!